AI Economy Timelines
A scenario-based model of frontier AI compute. Five components shipped, effective compute is next.
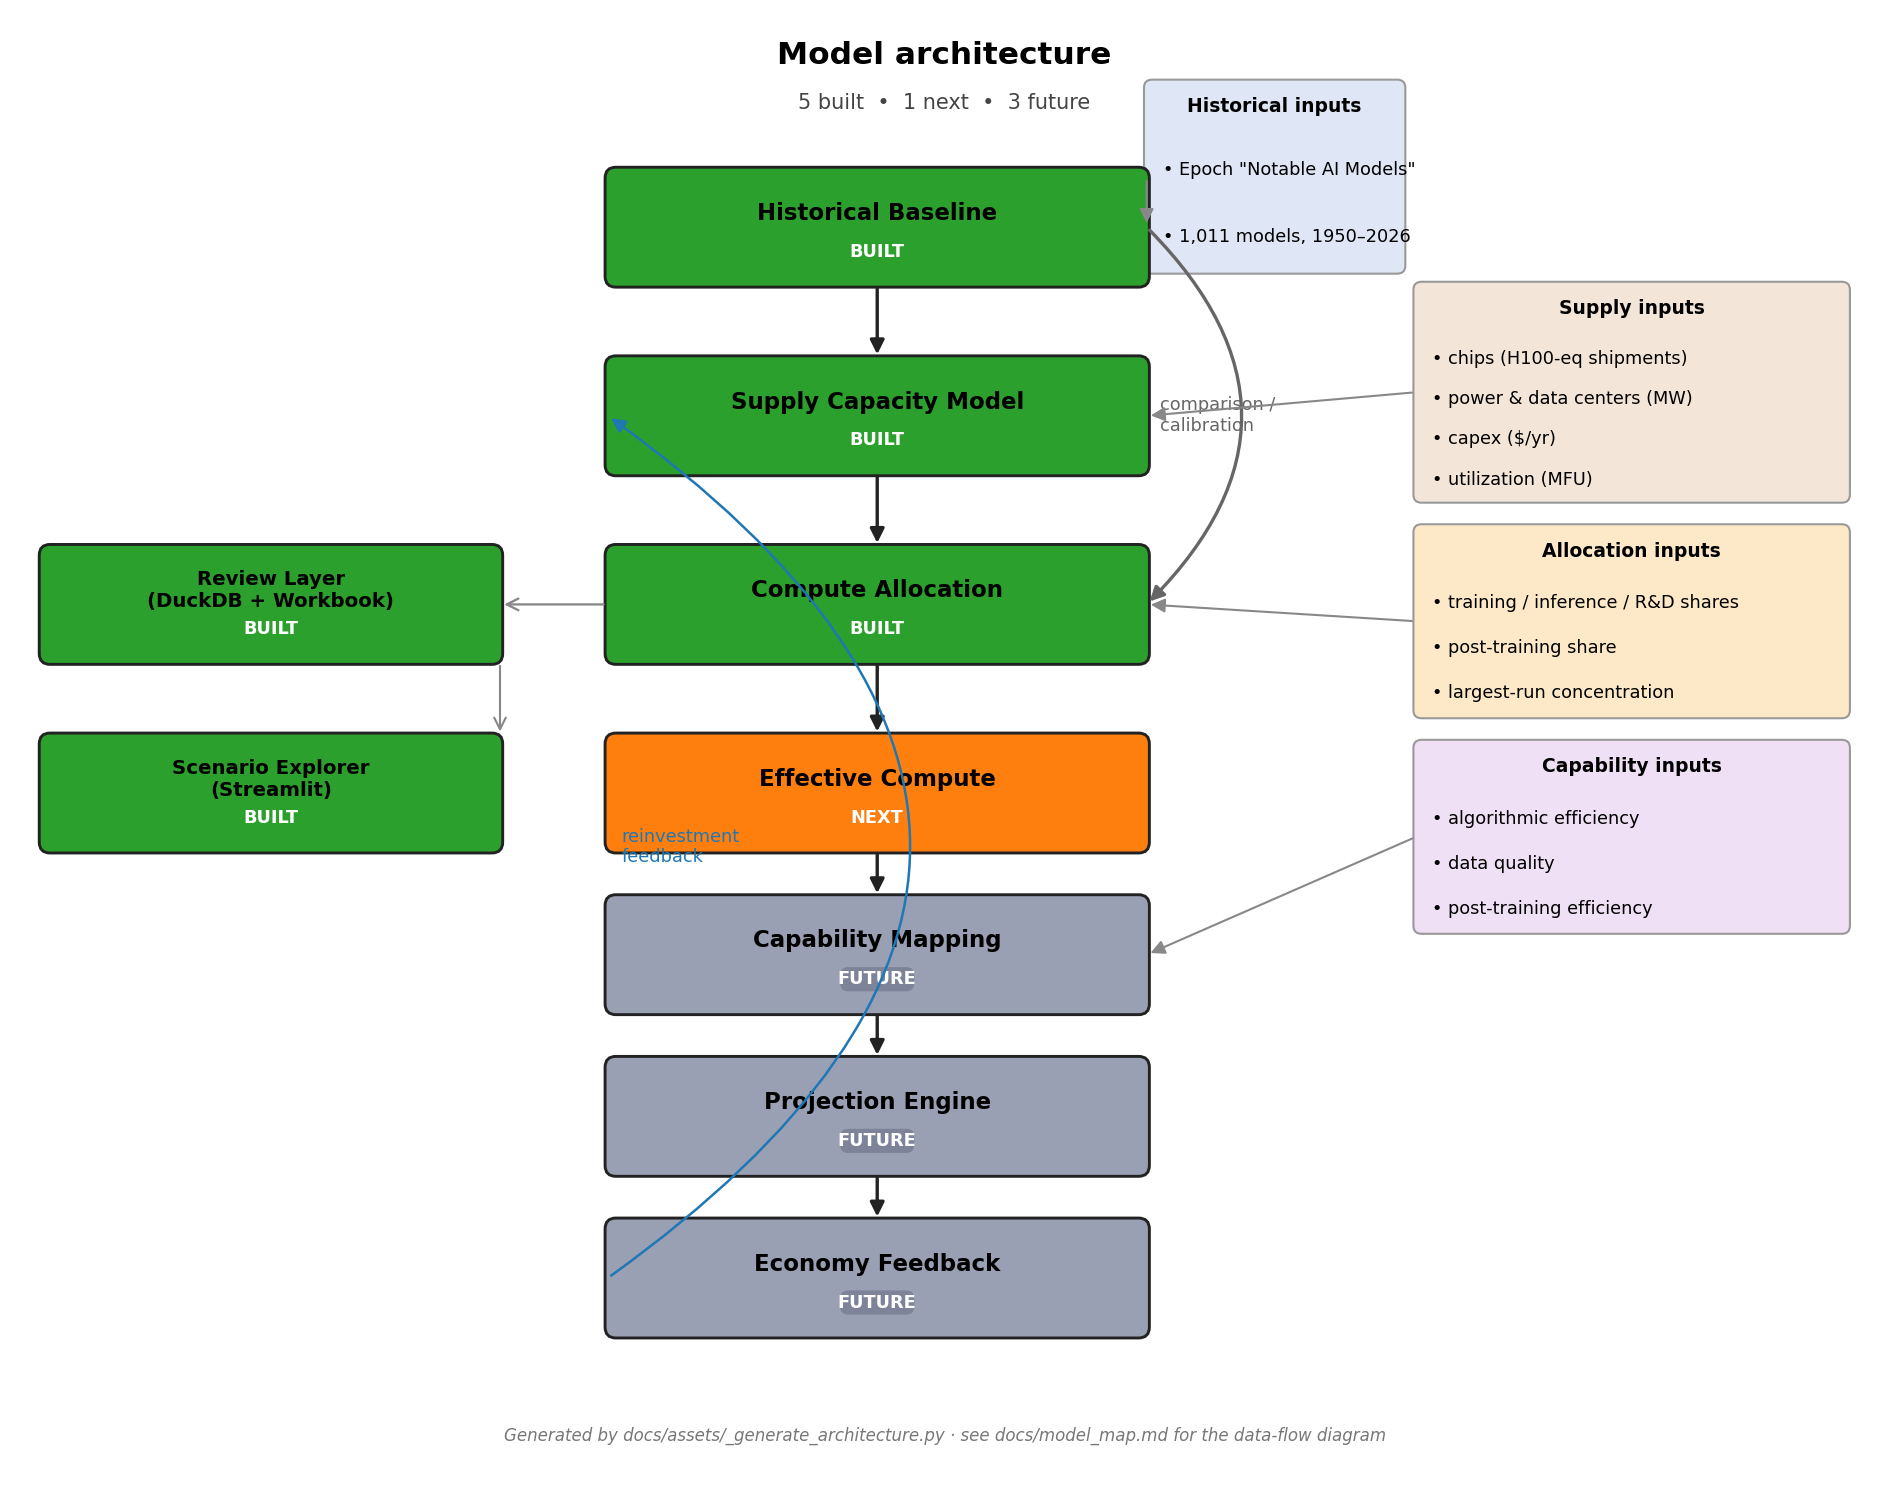
What this project is
| Component | Status | What it produces |
|---|---|---|
| Historical baseline | ✓ built | Empirical compute & spend trends from Epoch's "Notable AI Models" dataset |
| Supply capacity model | ✓ built | Forward 2024–2040 projection of total annual usable AI compute |
| Allocation layer | ✓ built | Splits supply into 6 buckets; produces largest_frontier_run_flop |
| Review layer | ✓ built | DuckDB review database + 11-sheet Excel workbook |
| Scenario explorer | ✓ built | Read-only Streamlit app on top of the DuckDB |
| Effective compute | ✗ next | Algorithmic-efficiency adjustment of raw FLOP |
| Capability mapping | future | Effective FLOP → task horizons / benchmark scores |
| Projection engine | future | Probabilistic combination of all upstream layers |
| Economy feedback | future | Revenue → reinvestment → supply-side capex |
Headline numbers
| Metric | Annual × | Doubling | R² | n |
|---|---|---|---|---|
| Training compute | 5.97× | 4.7 mo | 0.84 | 113 |
| Training cost (2023 USD) | 4.89× | 5.2 mo | 0.72 | 74 |
| Cost per FLOP | 0.76× (~24%/yr decline) | — | 0.21 | 74 |
| Scenario | 2024 (FLOP/yr) | 2040 (FLOP/yr) | CAGR | Binding 2030 |
|---|---|---|---|---|
| Baseline continuation | 3.97e+28 | 1.65e+31 | 45.7%/yr | capex |
| Capex-rich | 4.37e+28 | 2.89e+31 | 50.1%/yr | capex |
| Chip-constrained | 3.83e+28 | 6.54e+30 | 37.9%/yr | chip |
| Power/DC-constrained | 3.50e+28 | 6.64e+30 | 38.8%/yr | datacenter |
| Combined scenario | 2024 | 2040 | CAGR |
|---|---|---|---|
| capex_rich × training_race (fast) | 1.74e+27 | 9.38e+29 | 48.1%/yr |
| base × base (headline) | 1.39e+27 | 6.93e+28 | 27.6%/yr |
| chip_bottleneck × inference_heavy (slow) | 9.52e+26 | 7.84e+27 | 14.1%/yr |
Most important caution
Don't conflate single-run FLOP with total annual compute
The supply-capacity model estimates total annual usable AI compute. The allocation layer maps that to the largest frontier training run. Treating the historical 5.97×/yr frontier-run trend as a forecast of total compute, or treating supply / allocation projections as forecasts of single-run scaling without the bridging share parameters, is the most common reading mistake.
See the executive summary for the full framing.
Where to next?
- New to the project? Start with the executive summary, then model map.
- Looking at the outputs? See the output guide or model walkthrough.
- Want to inspect interactively? See the Streamlit demo guide.
- Want the per-component substance? Read the historical, supply, and allocation findings memos.
Run
uv sync
uv run historical          # rebuild historical-baseline deliverables
uv run supply              # rebuild supply-capacity deliverables
uv run allocation          # rebuild allocation deliverables (requires supply)
uv run database            # build the DuckDB review database
uv run workbook            # build the Excel review workbook
uv run demo                # launch the Streamlit scenario explorer
uv run validate-outputs    # confirm every artifact is present + non-empty
uv run pytest              # run the test suite (32 tests)
For the full repo structure, build instructions, and headline tables in plain README form, see the GitHub repository.